Which is more effective, the yield spread or the Buffett indicator?
In the posts on July 5th and July 7th, we introduced the Buffett indicator and the yield spread as indicators to determine whether stock prices are overvalued or undervalued. This time, let’s consider these indicators from a statistical perspective.
Unit Root Test on Yield Spread
In the post on July 7th, it was concluded that stock prices at the end of June were not overvalued when looking at the yield spread (“equity yield – 10-year bond yield”). However, upon performing statistical hypothesis testing, it was found that the yield spread cannot be rejected as a non-stationary process that performs a random walk, thus making it unsuitable as an indicator.
A non-stationary process is a random variable whose mean is not constant and whose variance (standard deviation) is also not constant.
As a result of the unit root test (ADF test), while the equity yield was found to be a stationary process (with constant mean and variance), the long-term interest rate was found to be non-stationary.
When a unit root test was also performed on the yield spread (“equity yield – 10-year bond yield”), it was found to be non-stationary. Since it is a combination of a stationary and a non-stationary process, it naturally becomes non-stationary.
Non-stationary processes do not have a stable average value and do not exhibit mean reversion properties. Therefore, even if the yield spread deviates significantly from the average, it cannot be said to return to a certain zone, making it unsuitable for determining overvaluation or undervaluation.
Unit Root Test on TOPIX and Nominal GDP
The Buffett indicator, which divides the market capitalization of stocks by nominal GDP, is also used as an indicator of overvaluation or undervaluation.
TOPIX is an index calculated using the market capitalization weighted average method, targeting all listed stocks on the Tokyo Stock Exchange, with the market capitalization on January 4, 1968, set as 100.
On the other hand, Japan’s GDP is published by the Cabinet Office, with the 2015 price as the latest standard, from the first quarter of 1994.
To align the baseline points, we converted the indices to 100 as of the first quarter of 1994 and observed the time series transition of TOPIX and the seasonally adjusted series of nominal GDP as follows. As of now, the latest GDP is the first quarter of 2024, so TOPIX is also considered until the end of March 2024.
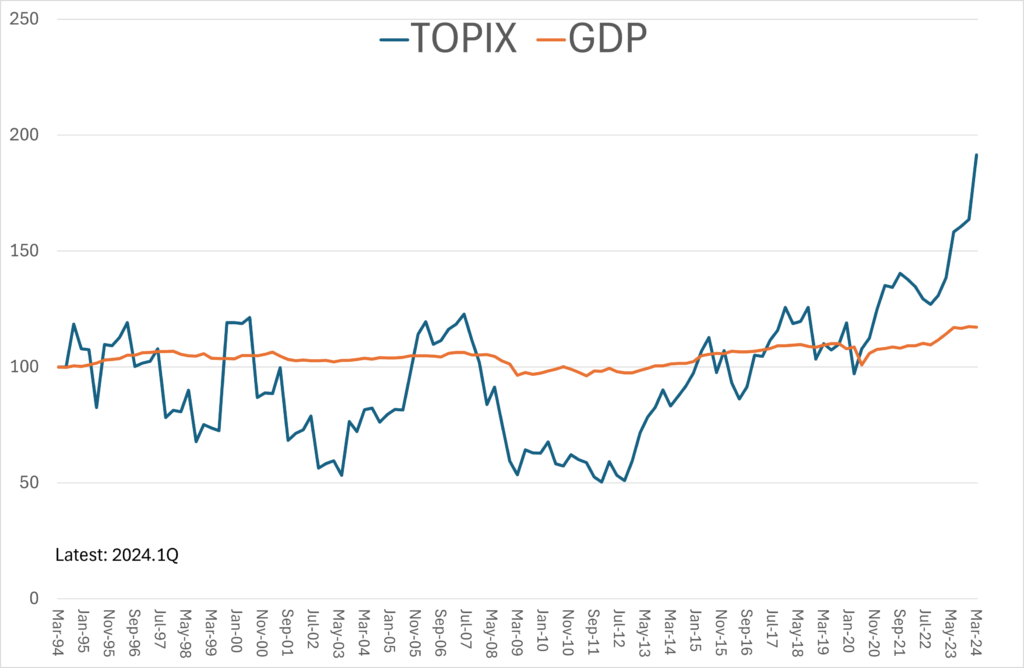
As a result of the unit root test (ADF test), both TOPIX and nominal GDP were found to be non-stationary processes with unit roots.
The Buffett indicator is defined as the market capitalization of stocks divided by nominal GDP, but when a unit root test was performed on the value obtained by dividing TOPIX (with the first quarter of 1994 as 100) by nominal GDP (with the same period as 100), it was suggested that the series is stationary, although the significance level was not very high.
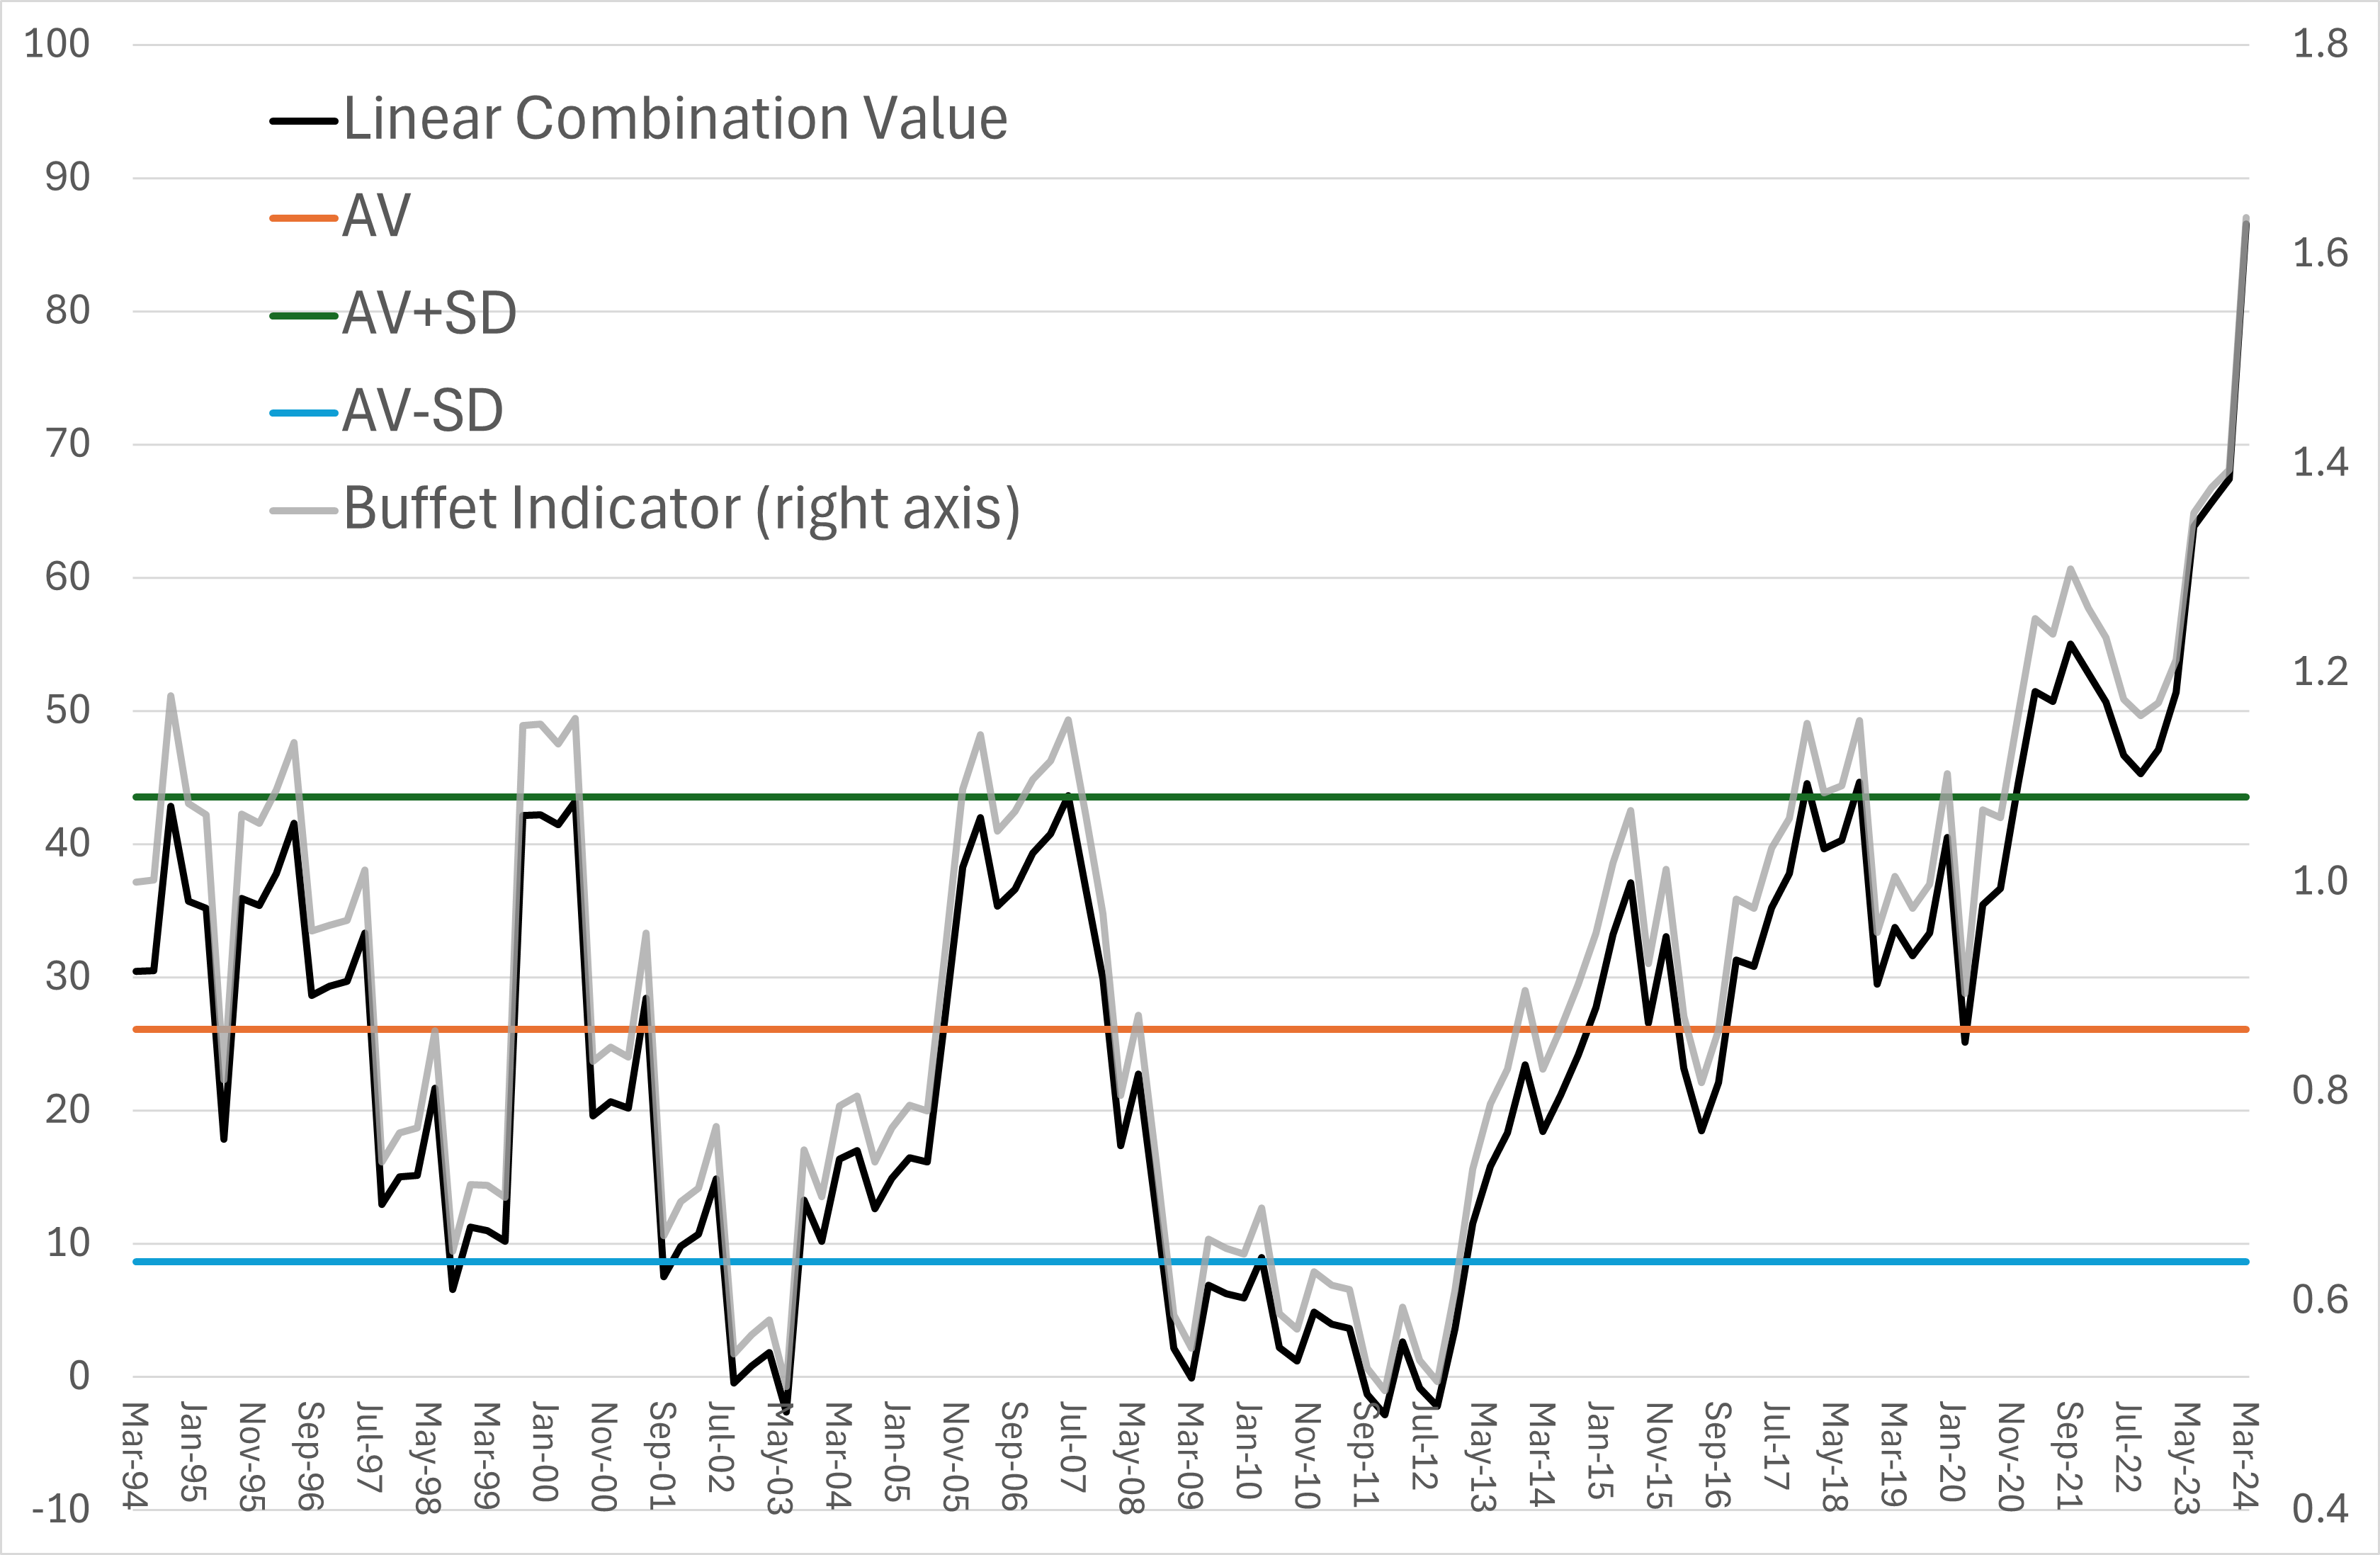
Linear Combination of TOPIX and Nominal GDP (and Buffett Indicator)
Conducting a cointegration test (Engle-Granger test, Johansen test) to see if TOPIX and nominal GDP, which both perform random walks, are linked, it was found that they are cointegrated (having a cointegration vector).
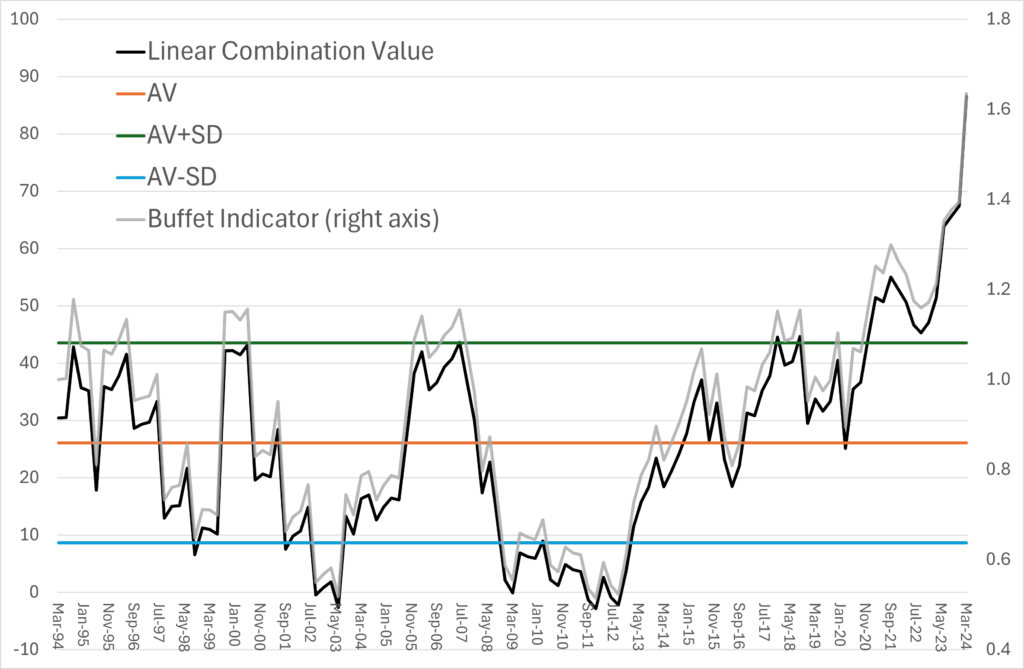
When forming a linear combination using this combination ratio (cointegration vector), it becomes 0.68496×TOPIX – 0.380635×nominal GDP.
A Shapiro-Wilk Normality Test on this Linear Combination Value showed that it follows a normal distribution. Following a normal distribution means that 68% of the values fall within the range of mean ± 1 standard deviation (AV+SD to AV-SD), and 95% fall within the range of mean ± 2 standard deviations.
The latest value at the end of March 2024 exceeded the mean + 2 standard deviations, indicating a considerable overvaluation.
The Buffett indicator, which divides TOPIX by nominal GDP (right axis), moves almost identically in appearance.
Summary
Since the equity yield is a stationary process and the long-term interest rate is a non-stationary process, the yield spread, which is the difference between the two, also becomes a non-stationary process, making it unsuitable for determining overvaluation or undervaluation.
However, since the equity yield is a stationary process, its inverse, the PER (Price-to-Earnings Ratio), is also a stationary process. Therefore, it is not meaningless to judge overvaluation or undervaluation by looking at PER alone. The weighted average PER of the Tokyo Stock Exchange Prime Market at the end of March 2024 was about 16 times, which is not high compared to the past.
On the other hand, the linear combination value of TOPIX and nominal GDP, detected by the cointegration test, indicated a considerable overvaluation. I would like to update the data when the GDP for the second quarter is released.
\ 最新情報をチェック /