Japanese Stock Prices Show Potential for Increase Based on PER, But…
In my previous post, I mentioned that while the Buffett indicator suggests Japanese stocks are significantly overvalued, the PER (Price Earnings Ratio) is not particularly high. This time, I will examine the reasons behind this.
On August 3, 2024, after a significant drop in stock prices on August 2, an article in the Nikkei Shimbun (page 3) explained that corporate profits had been inflated by the weak yen.
Nominal GDP only accounts for domestic profits, whereas EPS (Earnings Per Share) includes profits from overseas branches and subsidiaries, converted to yen. Consequently, the depreciation of the yen boosted EPS, preventing the PER from rising even though stock prices increased. On the other hand, nominal GDP does not include profits earned abroad by companies, which is why the Buffett indicator rose with higher stock prices.
PER (Based on Forecast EPS)
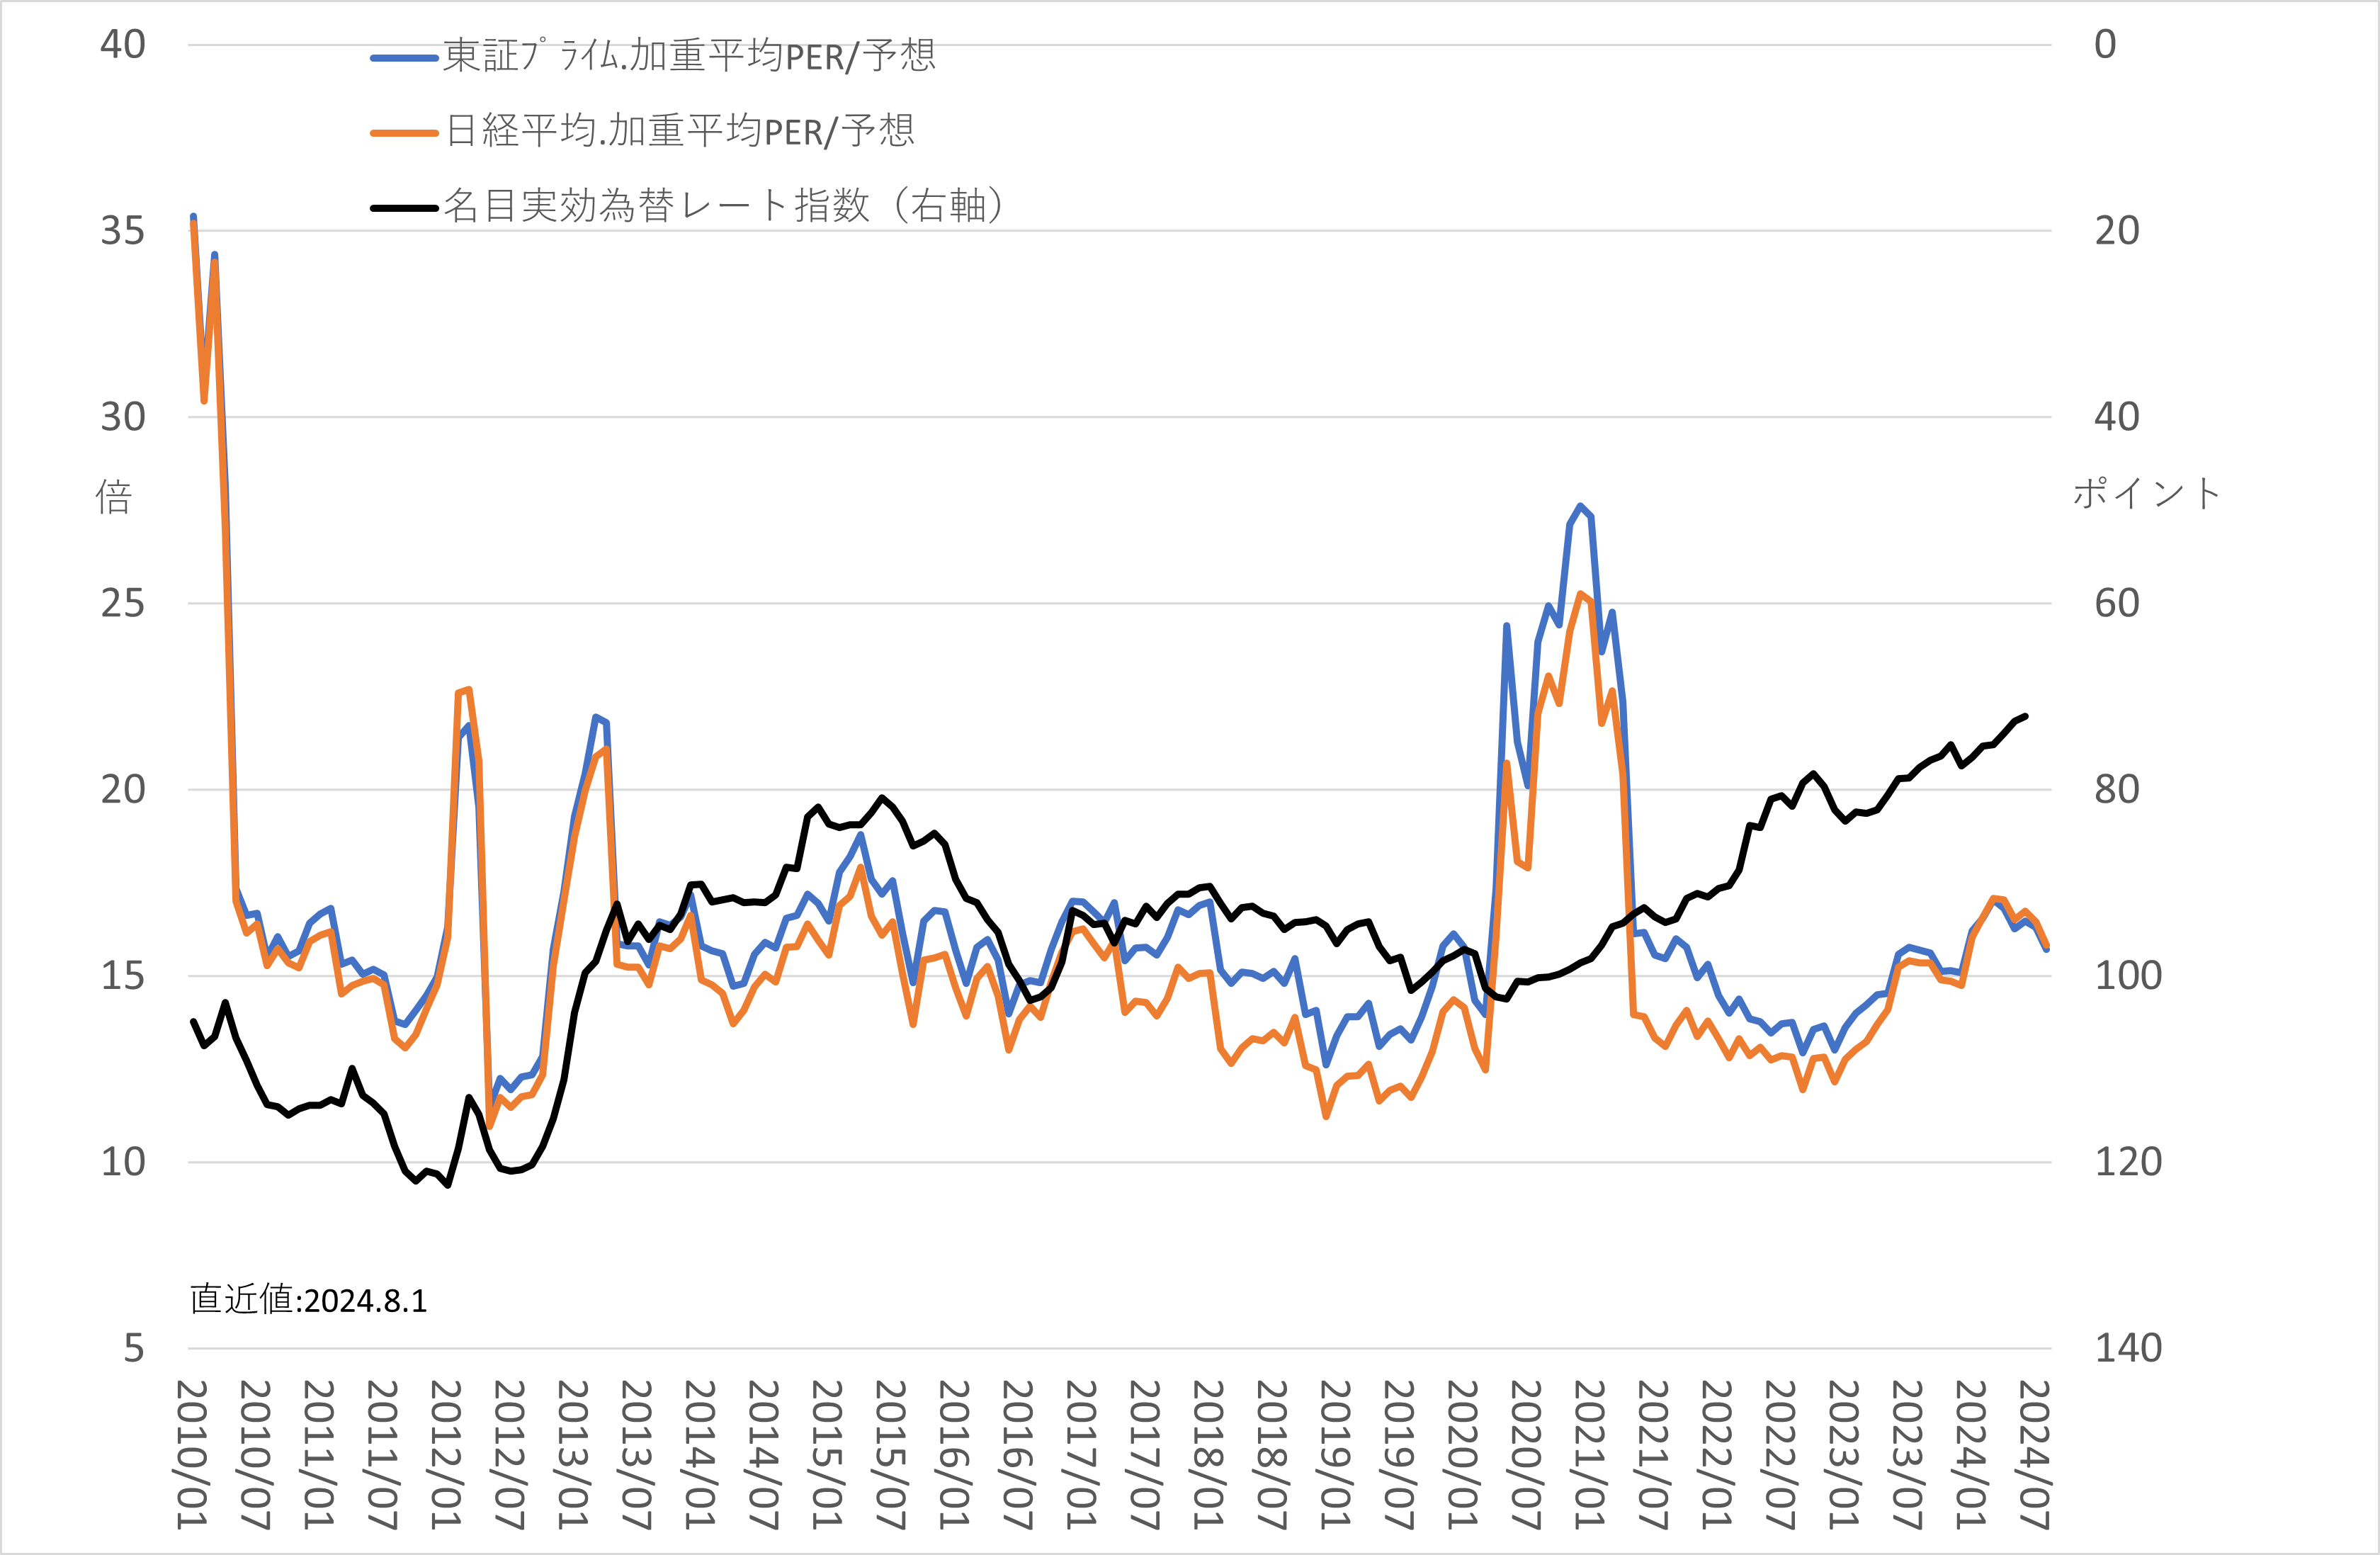
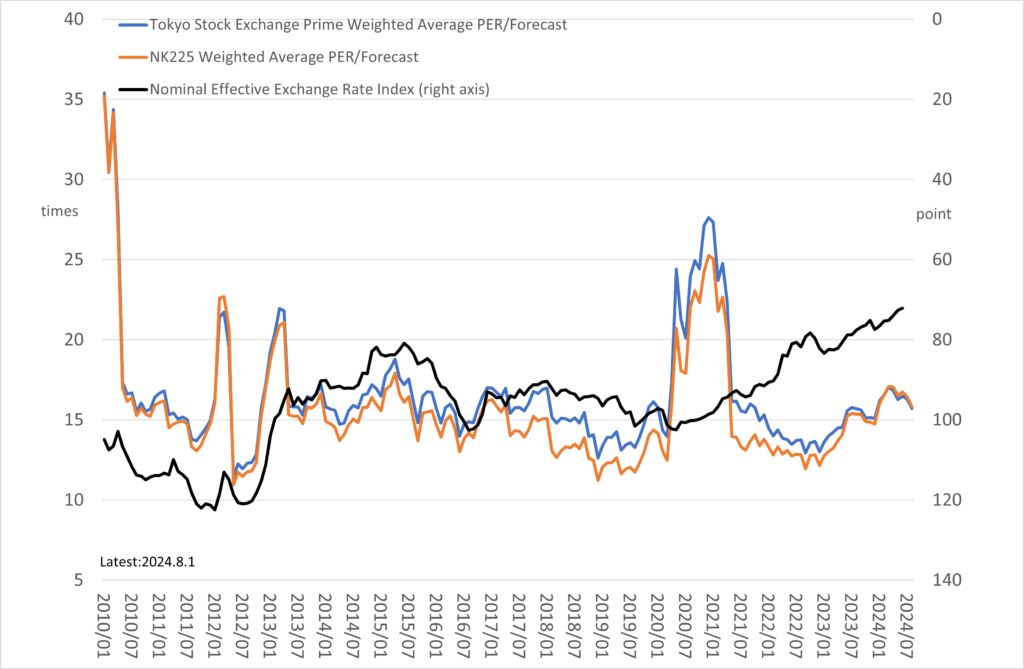
Typically, the PER is calculated by dividing the stock price by the forecasted EPS for the next fiscal year. When conducting a unit root test on the market capitalization-weighted average PER for the Tokyo Stock Exchange Prime Market and the Nikkei 225 from the end of September 2000 to August 1, 2024, it can be confirmed that neither is a unit root process but rather a stationary process.
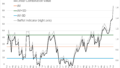
From the graph used in the previous post, it can be seen that the linear combination of TOPIX and nominal GDP has risen above “the average + 1 standard deviation” since 2020, while the PER has declined since the same year.
In the graph above, the nominal effective exchange rate of the yen, which includes foreign currencies other than the US dollar, is overlaid, showing that the yen has been depreciating since the same period.
EPS is calculated using the consolidated figures from domestic headquarters and overseas subsidiaries. According to the “Basic Survey of Overseas Business Activities” and the “Quarterly Survey of Overseas Subsidiaries” by the Ministry of Economy, Trade and Industry, although the sales of local subsidiaries in dollar terms have not increased significantly since the fiscal year 2020, the sales and recurring profits in yen terms have increased due to the yen’s depreciation. As a result, EPS has been inflated.
Even if it is due to the yen’s depreciation, an increase in EPS still means that stock prices are not overvalued when viewed through PER.
Most Overseas Sales Do Not Reflow to Japan
However, taking the fiscal year 2022 as an example, although the sales of overseas subsidiaries amounted to 361.5 trillion yen, their recurring profits were only 19.6 trillion yen, meaning that most of the sales revenue was spent on local personnel costs and other expenses, and did not return to Japan.
Furthermore, there is little difference between the rise in stock prices due to EPS inflation caused by the yen’s depreciation and the rise in stock prices due to an increase in EPS driven by higher prices.
While a rise in stock prices is beneficial for shareholders, unless overseas profits are reinvested in domestic capital expenditures or wage increases, it does not seem to address the fundamental issues of the Japanese economy. I would like to consider this point, along with the terms of trade and real wages, on another occasion.
Nominal GDP and Domestic Corporate Profits Are Linked
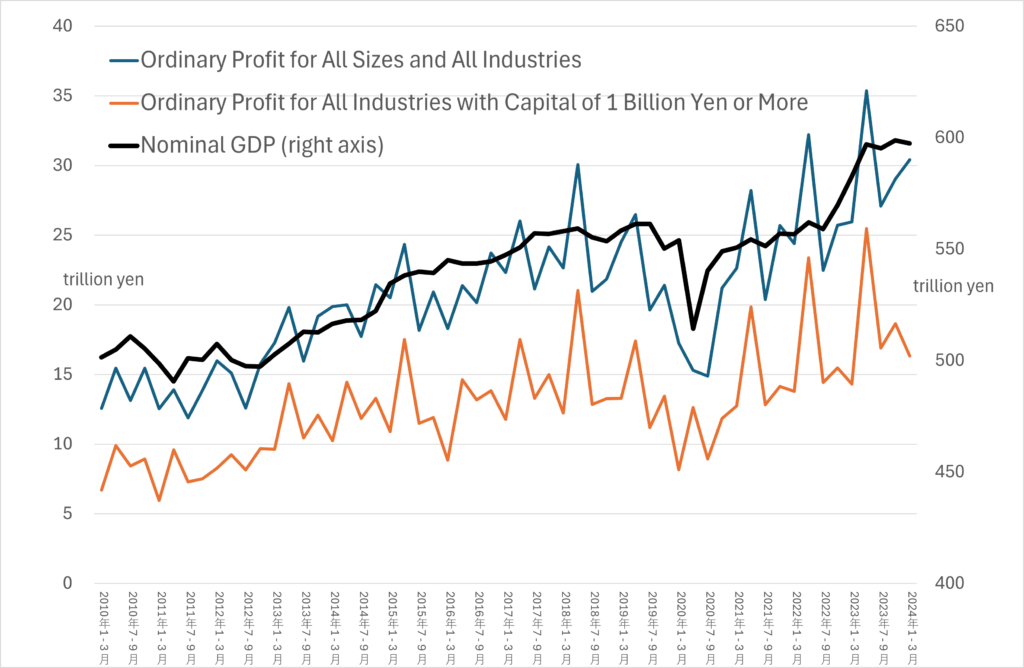
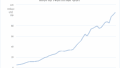
The recurring profits of domestic companies on a standalone basis can be obtained from the “Financial Statements Statistics of Corporations by Industry” compiled by the Ministry of Finance.
It can be seen that recurring profits are linked to nominal GDP (seasonally adjusted). Considering this alongside the previous post, the significant deviation of stock market capitalization from nominal GDP suggests that the overseas portion of corporate profits has become larger due to the yen’s depreciation.
It might be easier to understand if you think about it this way:
\( \[ \frac{\text{Stock Market Capitalization}}{\text{Nominal GDP}} > \frac{\text{Stock Price}}{\text{Domestic Earnings Per Share} + \text{Overseas Earnings Per Share}} \]\)\ 最新情報をチェック /