
Global GDP and MSCI ACWI
In the post on August 4th, I wrote that since EPS includes profits earned overseas, stock prices are not considered overvalued when viewed through PER.
However, in the post on August 1st, I also noted that according to the Buffett indicator, which compares market capitalization to nominal GDP, stocks appear to be significantly overvalued.
The major difference between PER and the Buffett indicator can be attributed to whether or not overseas profits are included. A significant portion of domestic companies’ overseas sales should contribute to the GDP of the local countries.
Therefore, it might be inappropriate to evaluate the stock prices of companies expanding overseas based on the domestic GDP.
It should be noted that this consideration is about the fair value of stock prices, and the domestic economic trends need to be considered separately.
Global GDP Until 2023
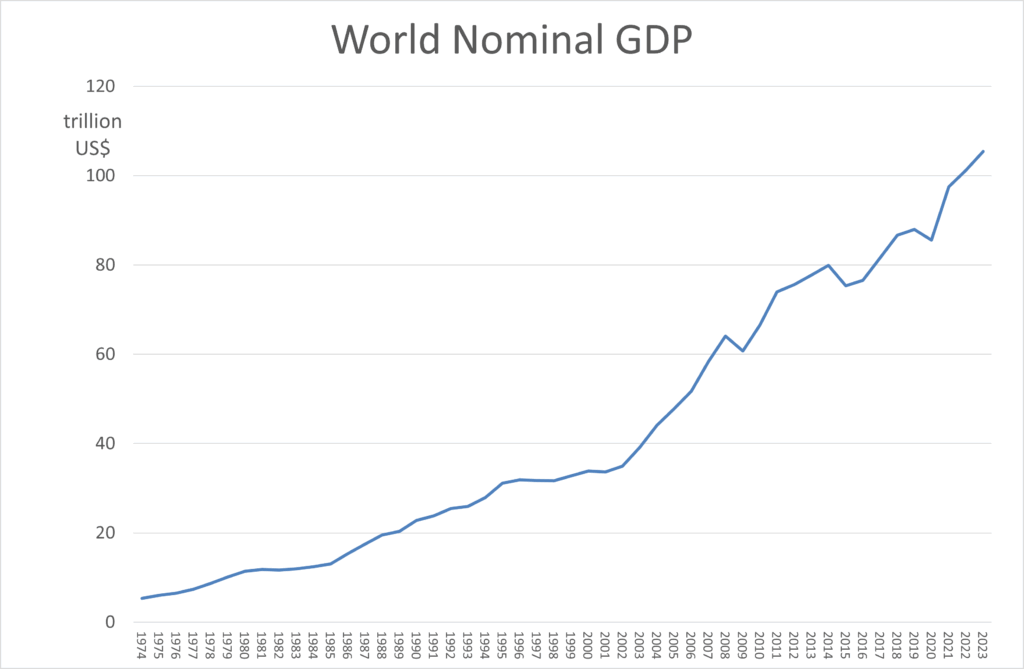
The World Bank has been publishing GDP data for various countries and the global total since 1974. While the latest available data is up to 2023, it shows continuous growth over the long term with occasional minor adjustments.
Global Market Capitalization
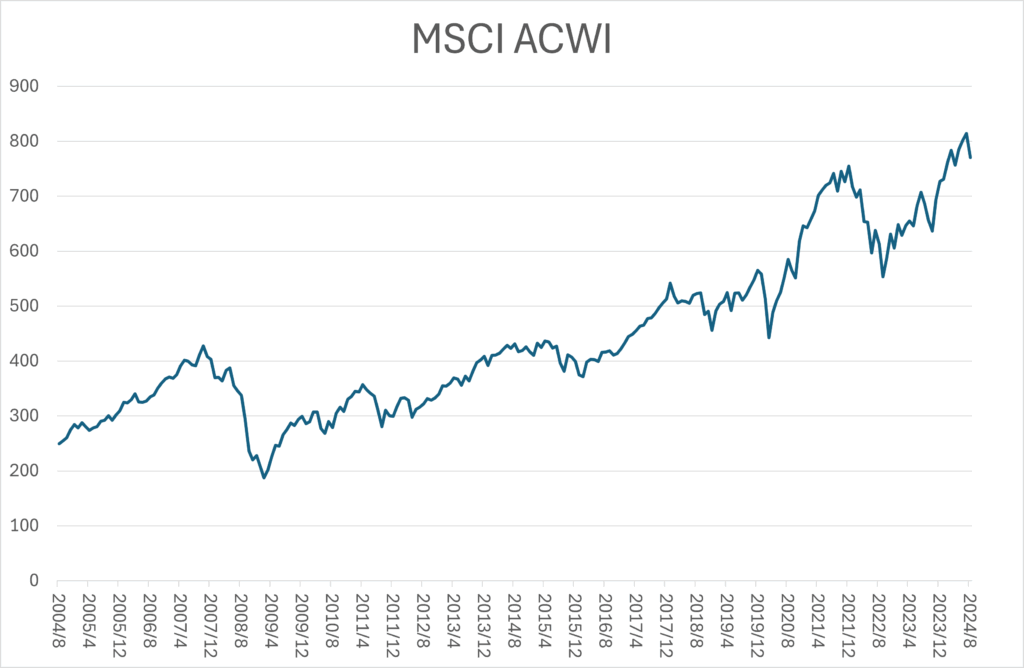
Next, let’s look at the market capitalization of the global stock market. Indexes such as the MSCI ACWI and the FTSE All-World Index reflect this, and both show similar trends. For this analysis, I used the MSCI ACWI data from investing.com on a monthly basis from the end of August 2004 to the close of August 6, 2024.
The ACWI, or All Country World Index, is a comprehensive stock index created by Morgan Stanley Capital International, which tracks the performance of global stock markets. It covers 23 developed countries and 24 emerging markets, totaling 47 countries, and consists of approximately 2,900 large and mid-cap stocks.
The index is weighted at 85% developed markets and 15% emerging markets. The U.S. has the largest weight, accounting for about 60% of the index, and the components are reviewed quarterly. The ACWI covers about 85% of the investable global stock market using a market capitalization-weighted methodology. In Japan, index funds like eMAXIS Slim All Country World Stocks that track the ACWI are popular.
While the U.S. accounts for 60%, with a significant portion from large U.S. tech companies, this index is suitable for observing global stock market capitalization trends despite potential concerns about diversification in global stocks.
Global Market Capitalization to Global Nominal GDP
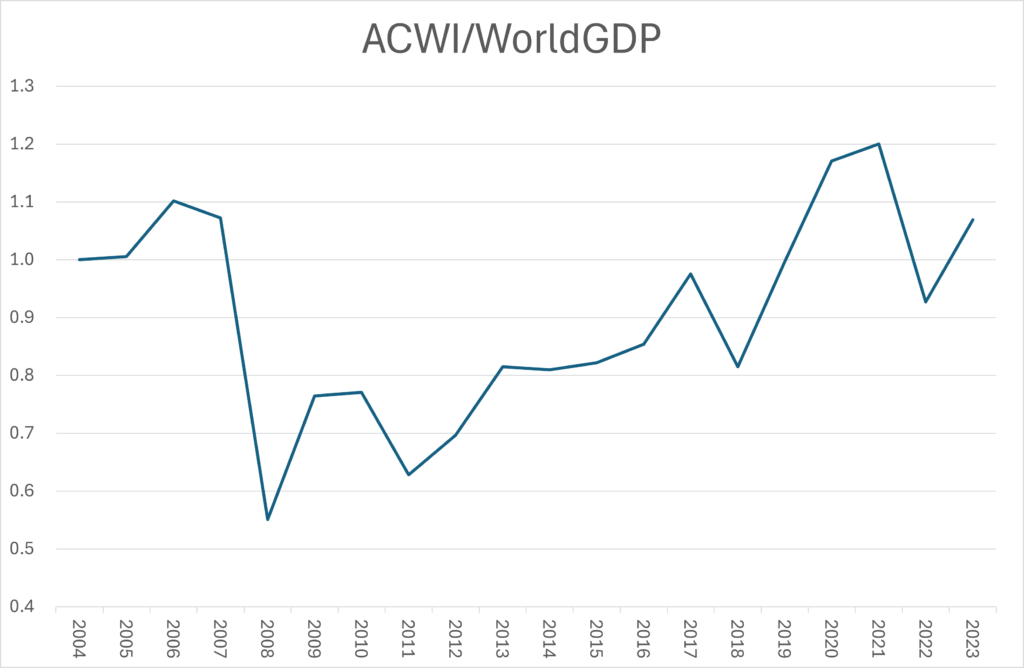
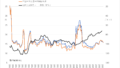
Using ACWI data from investing.com since 2004, I converted ACWI and global nominal GDP into indices, setting the start point at 100, and calculated ACWI divided by global nominal GDP.
Given the limited annual data points, I did not conduct unit root or cointegration tests. However, the graph up to the end of 2023 suggests that the data fits within a certain range.
As we enter August 2024, global stock prices are experiencing volatility. It is difficult to determine from the data up to 2023 whether this is the beginning of a major correction or a temporary fluctuation. I will re-examine the situation once more data becomes available.
\ 最新情報をチェック /