The yield curve is a graph that plots the interest rates of government bonds with different maturities, illustrating the relationship between short-term and long-term interest rates.
Note: While spot rates or swap rates are often used, this discussion will focus on government bond yields.
The yield curve is a crucial indicator for predicting economic outlooks and is particularly noteworthy for the following three reasons:
- Economic Growth Prediction:
The shape of the yield curve reflects how investors view the future of the economy. Generally, longer-term interest rates (yields) are higher, resulting in an upward-sloping curve, known as a normal yield curve. A steeper slope indicates optimistic economic growth expectations. Conversely, an inverted yield curve often signals an impending economic recession. - Monetary Policy Indicator:
Central banks refer to the yield curve when setting interest rate policies. Short-term rates are strongly influenced by the central bank’s policy rates, and thus, the shape of the yield curve indicates the impact of monetary policy. Long-term rates are the average of future short-term rates plus a liquidity premium. If the policy rate remains constant, the yield curve will be flat or slightly upward due to the liquidity premium. - Investment Strategy Guide:
Investors use the yield curve to develop investment strategies. For example, in the case of an inverted yield curve, the price of long-term bonds is higher. Investors can short sell long-term bonds, buying them back at a lower price later to make a profit.
A free site where you can compare interest rates across countries simultaneously is Investing.com. For periods where rates are not available on this site, linear interpolation using values from surrounding periods will be applied.
Let’s look at the specific shapes of the yield curves for various countries and the economic outlook based on these shapes. The data was obtained as of July 12.
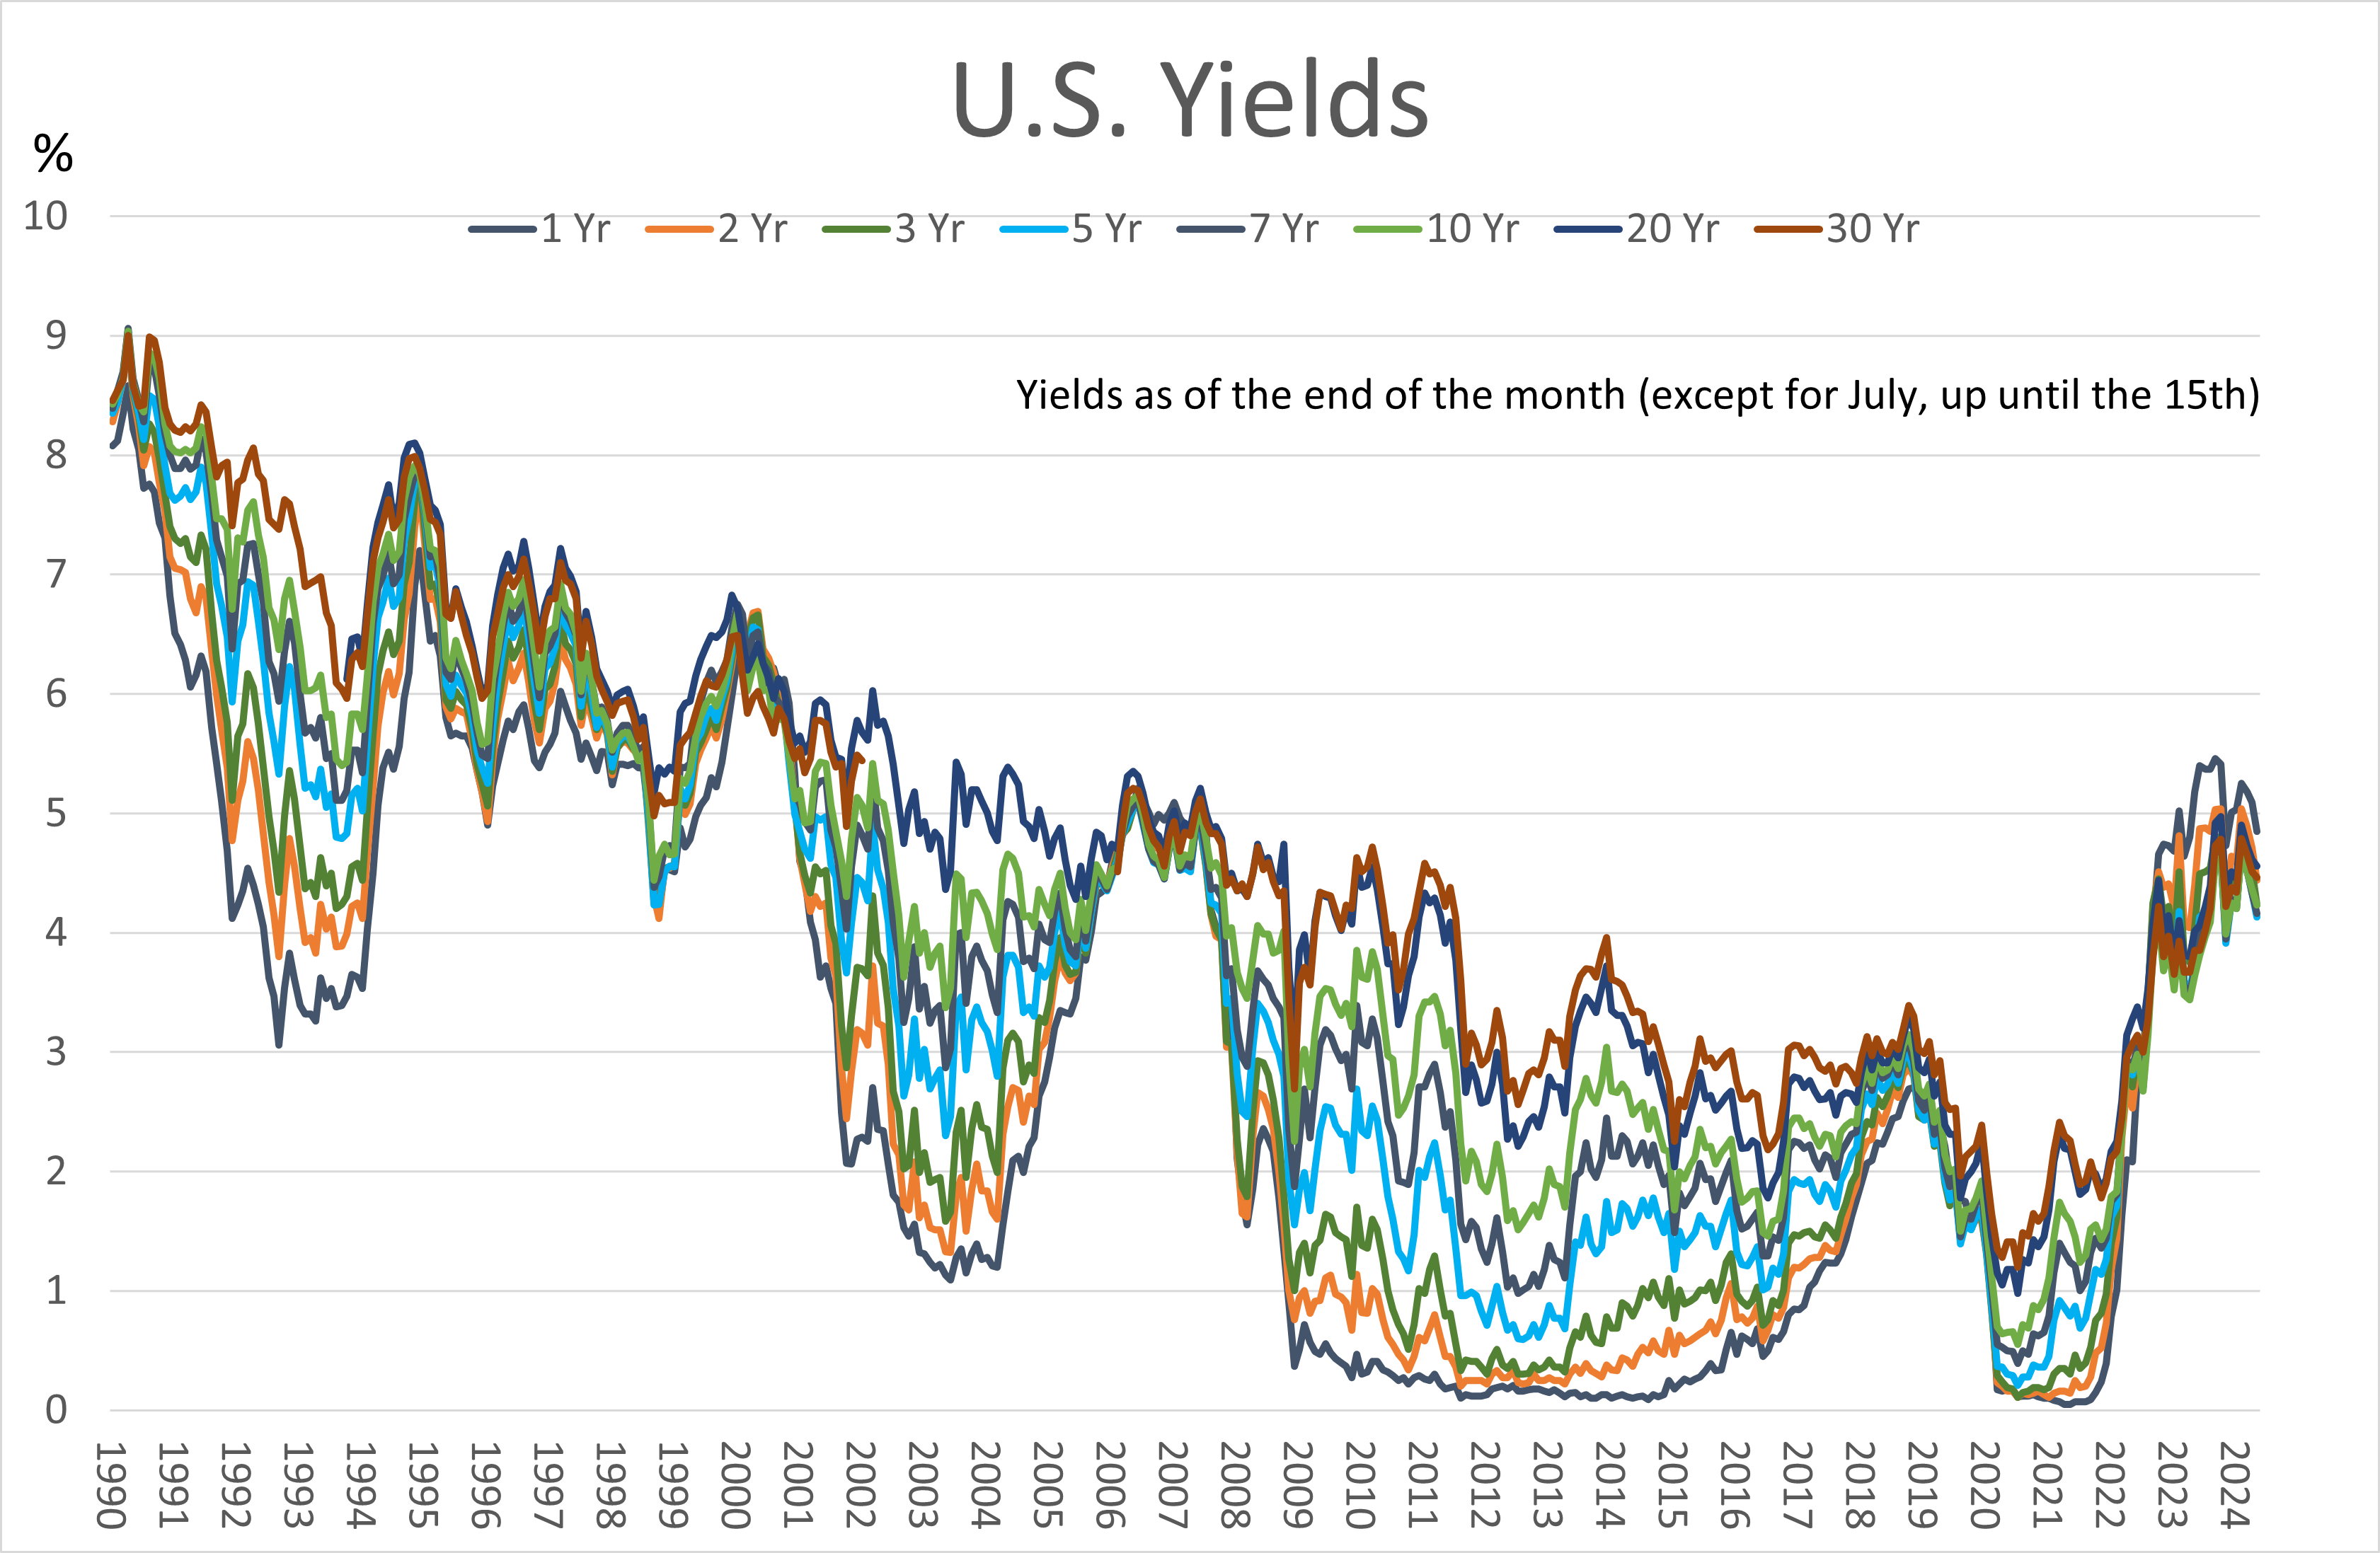
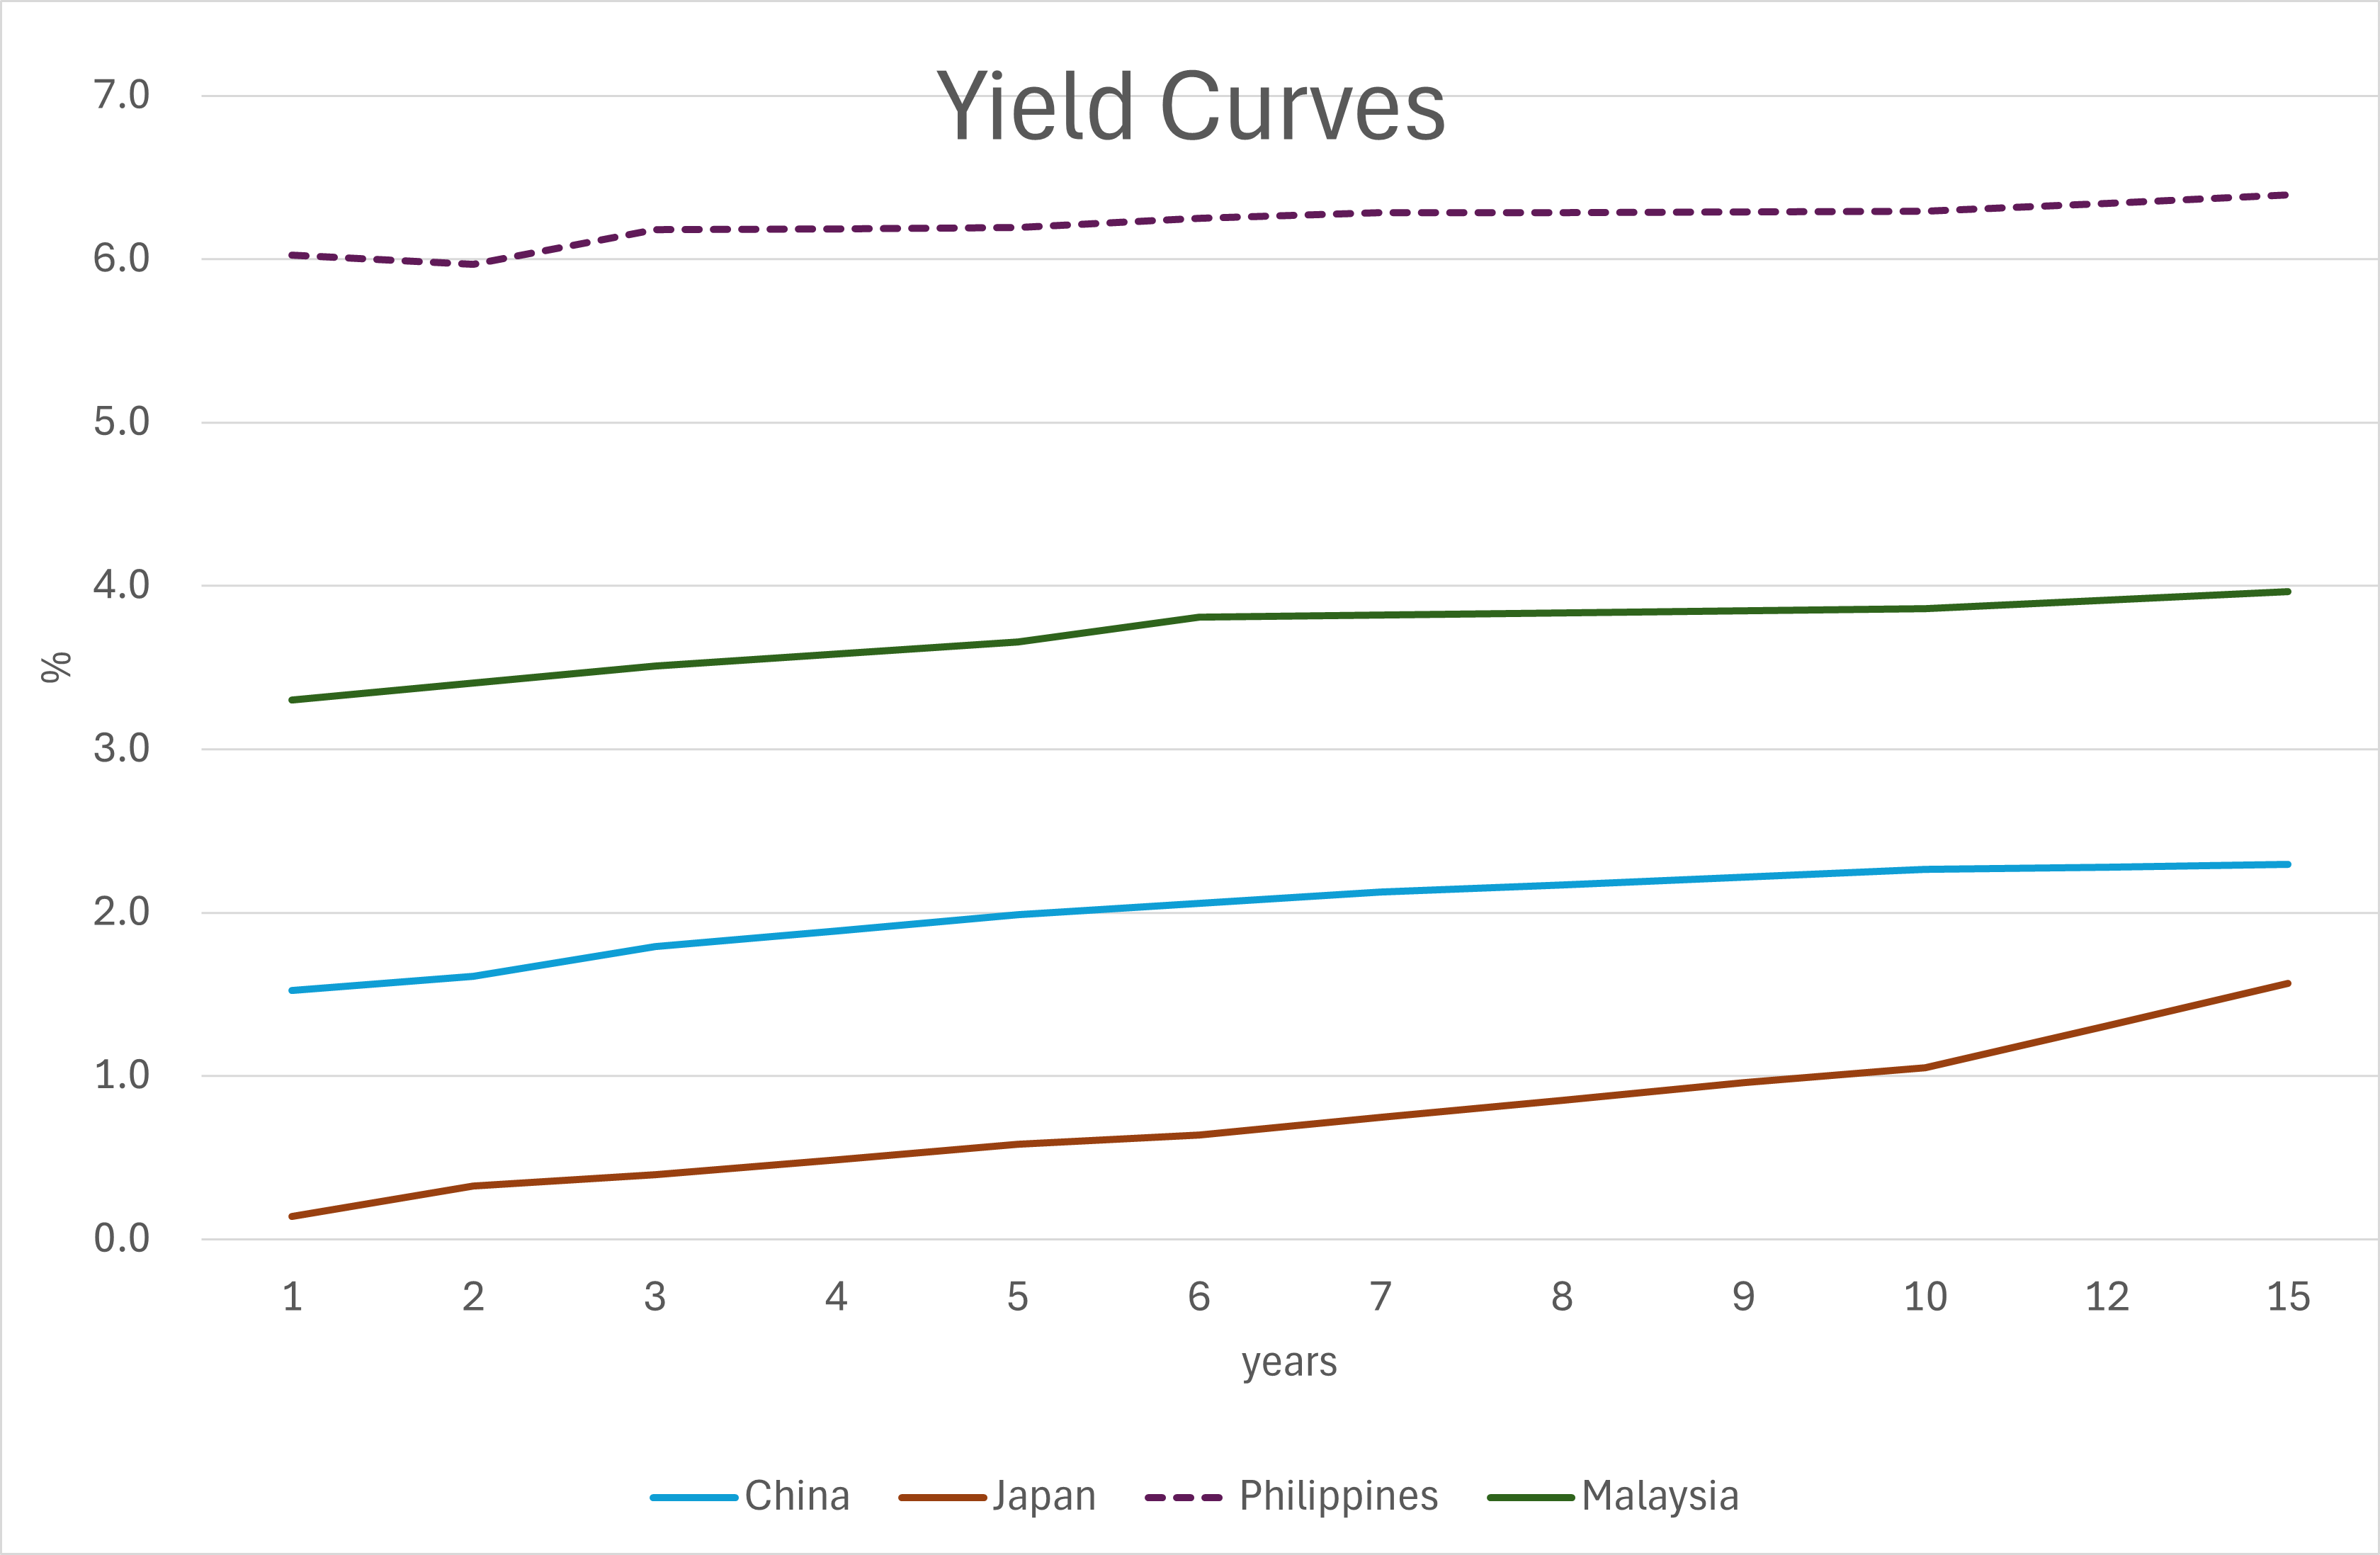
Countries with Normal Yield Curves
Examples: China, Japan, Malaysia, Philippines
These countries’ yield curves are upward-sloping, with long-term rates higher than short-term rates, indicating expectations of economic growth or inflation. Despite being a normal yield curve, Japan’s yield curve is positioned lower than those of other countries, suggesting lower expectations for economic growth and inflation.
Countries with Low Mid-Term Rates and Concave Yield Curves
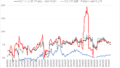
Examples: Australia, Germany, UK, USA
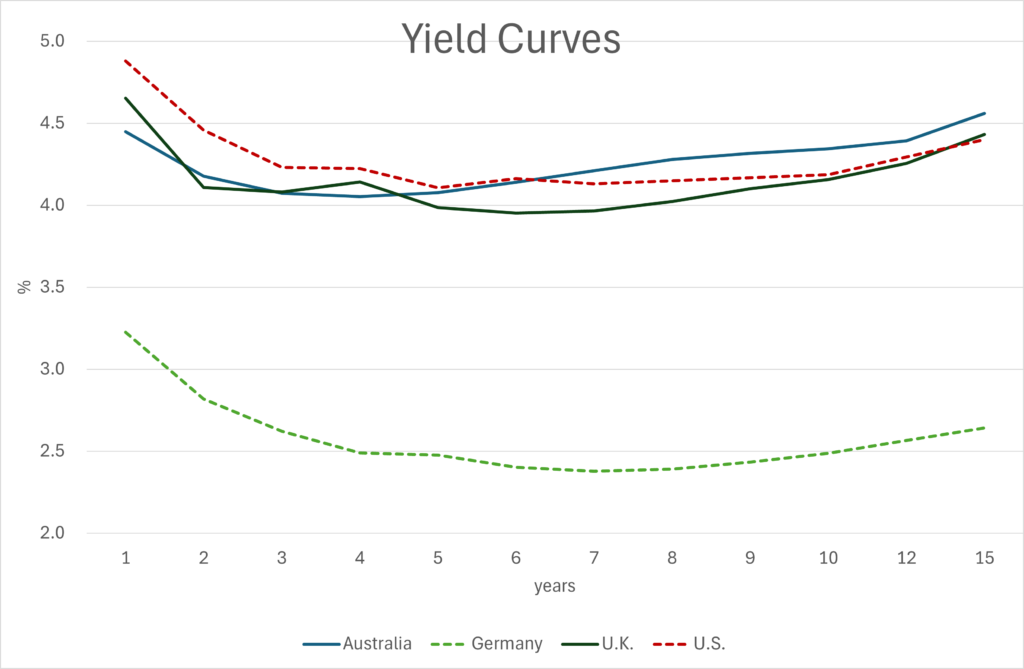
These countries have yield curves with lower mid-term rates, creating a concave shape. This unusual shape reflects specific economic conditions or market expectations.
Reasons for Low Mid-Term Rates and Concave Yield Curves:
- Impact of Monetary Policy:
Central banks’ policies can significantly influence this shape. For example, if a central bank keeps short-term rates high while long-term rates rise due to market inflation expectations or growth projections, mid-term rates may behave differently. - Inflation Expectations:
If market participants expect lower inflation in the mid-term, this expectation can lower mid-term bond yields, resulting in lower mid-term rates. - Demand and Supply Mismatch:
High demand for bonds of specific maturities can push down yields for those maturities. For instance, if pension funds or insurance companies purchase a large volume of mid-term bonds, it can create such a yield curve shape. - Uncertainty in Economic Growth:
Increased uncertainty in long-term economic growth may lead investors to prefer mid-term bonds over long-term bonds, lowering mid-term yields. - Liquidity Premium:
o If mid-term bonds are more liquid compared to other maturities, the liquidity premium will be lower, resulting in lower yields. The liquidity premium refers to the additional return investors demand for less liquid assets.
Summary
The yield curve provides valuable insights into the economic conditions and future trends. Understanding and monitoring it can offer a more accurate forecast of overall economic movements.
\ 最新情報をチェック /